Leading University Creating Innovation for Sustainable Future


Healthy University Rating System (HURS)
University : Siam University
Country : Thailand
Web Address : https://sustainability.siam.edu
HP 1 Health Literacy
[1.2] Effective Assessment and Utilization of KAP on Healthy Lifestyle
| 1. Baseline KAP assessment – the same pre-participation survey in three NODE Phasi Charoen communities |
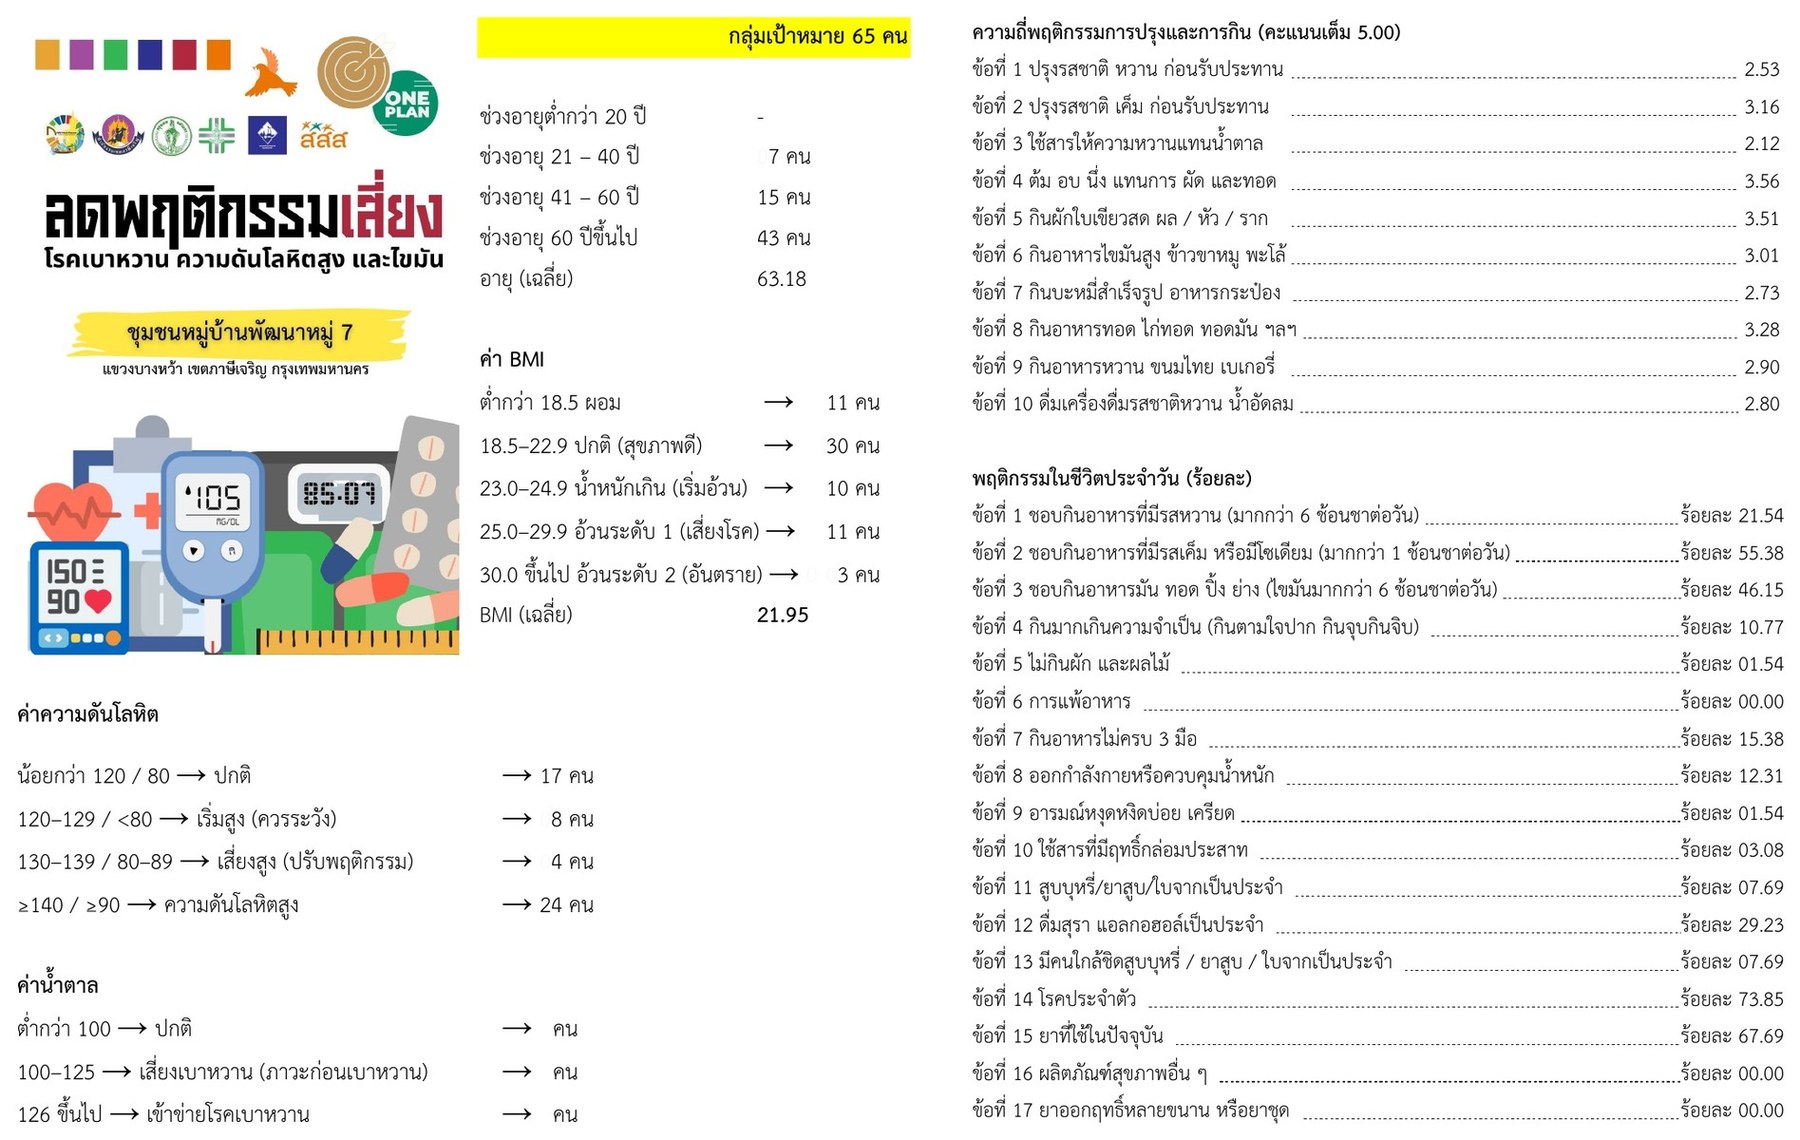 |
| Pattana Mu 7 Village: survey summary of 65 participants – health measures, cooking and eating practices, daily practices and confidence to change |
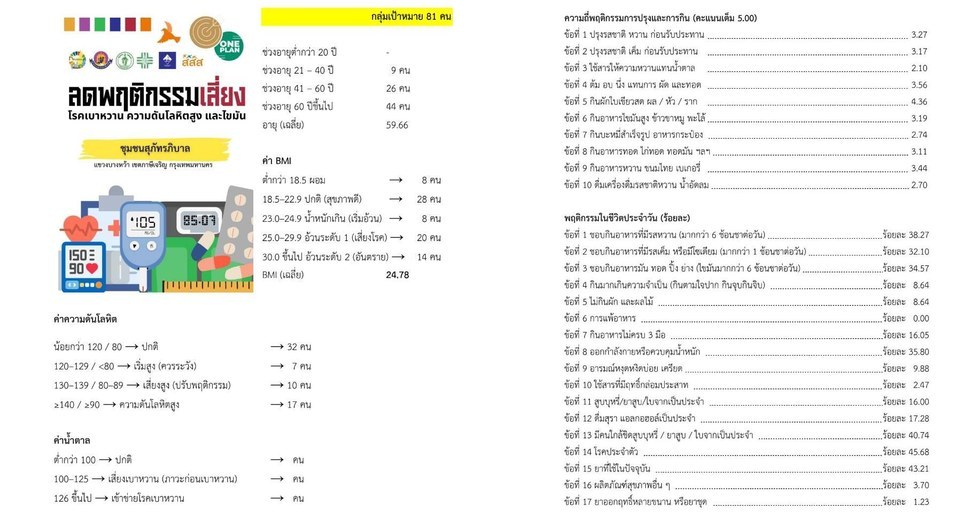 |
| Suphatthara Phiban Community: survey summary of the target group of 81 people |
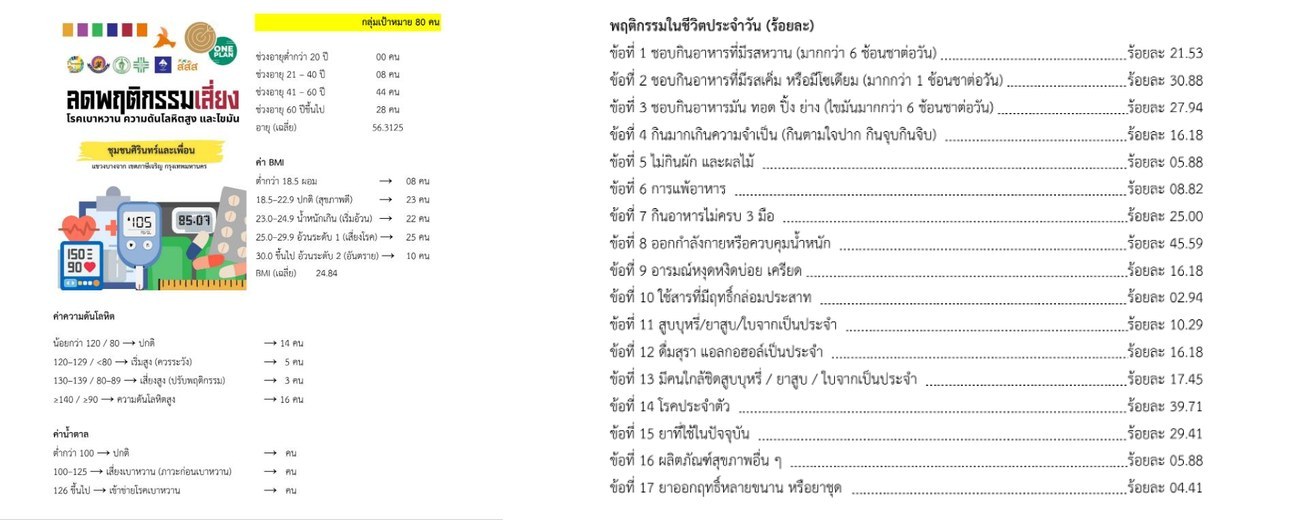 |
| Sirin and Friends Community: survey summary of the target group of 80 people |
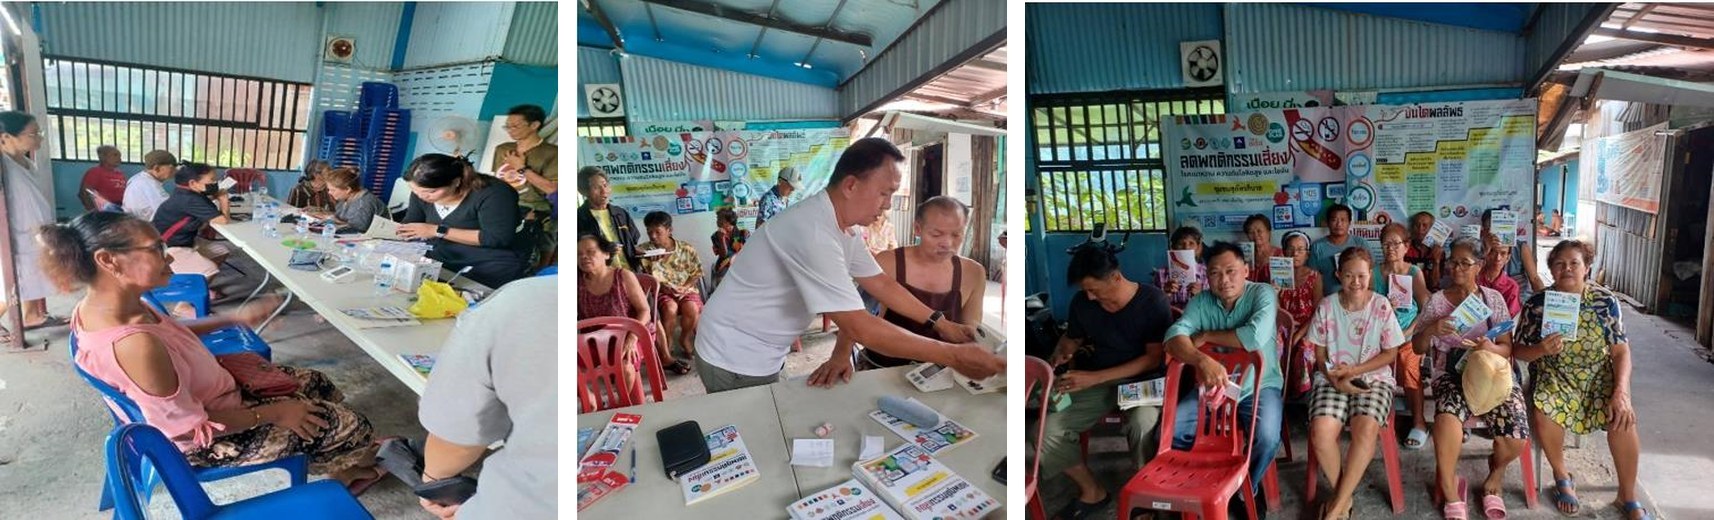 |
| Suphatthara Phiban: behaviour survey and health screening forum – blood pressure, BMI, blood sugar, body fat, muscle mass and waist (15 September – 19 October 2025) |
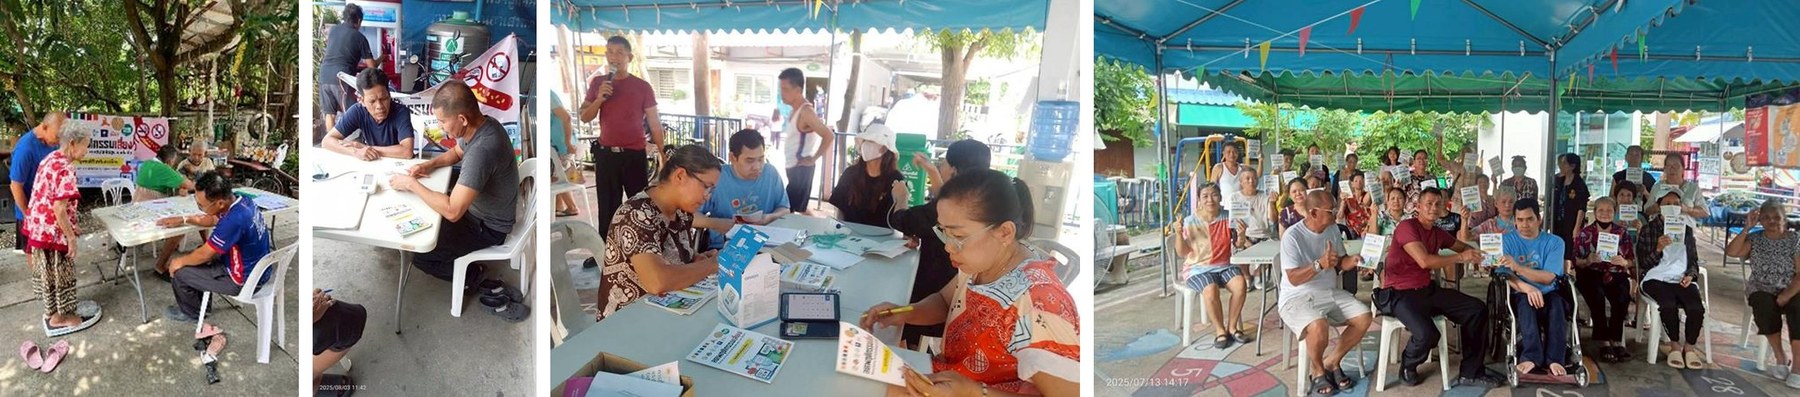 |
| Sirin and Friends: health screening and behaviour survey of the risk group, with individual health record books (July – August 2025) |
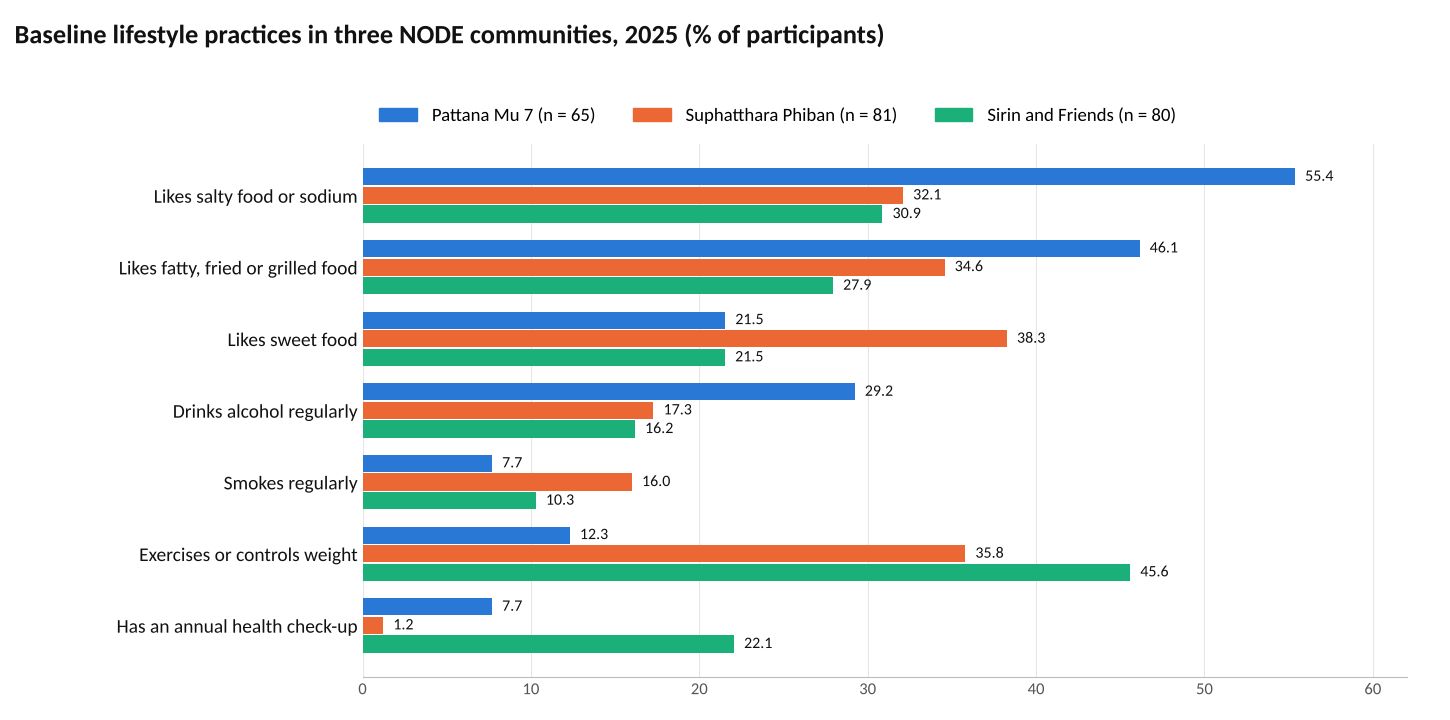 |
| Baseline practices differ between communities: salty and fatty food were most common in Pattana Mu 7, sweet food in Suphatthara Phiban; few people had an annual check-up |
| 2. Use of the results – training by Siam University lecturers, group rules and individual plans |
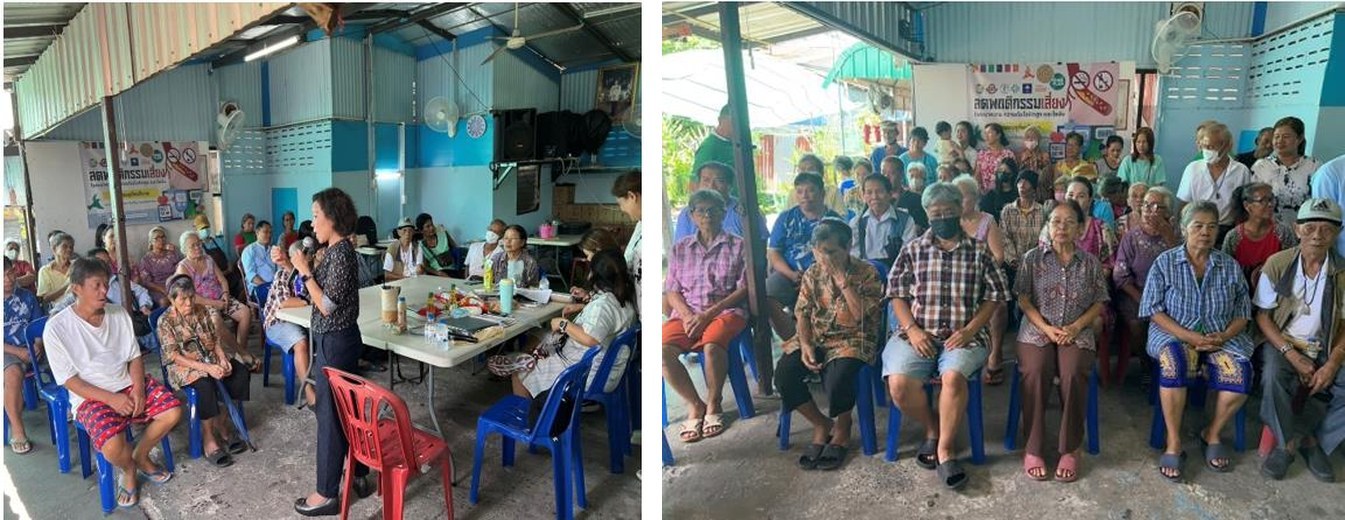 |
| Suphatthara Phiban: Siam University lecturers return the health data and train the risk group on “3 Or 2 Sor” healthy living – diet, exercise, emotion, no smoking, no alcohol |
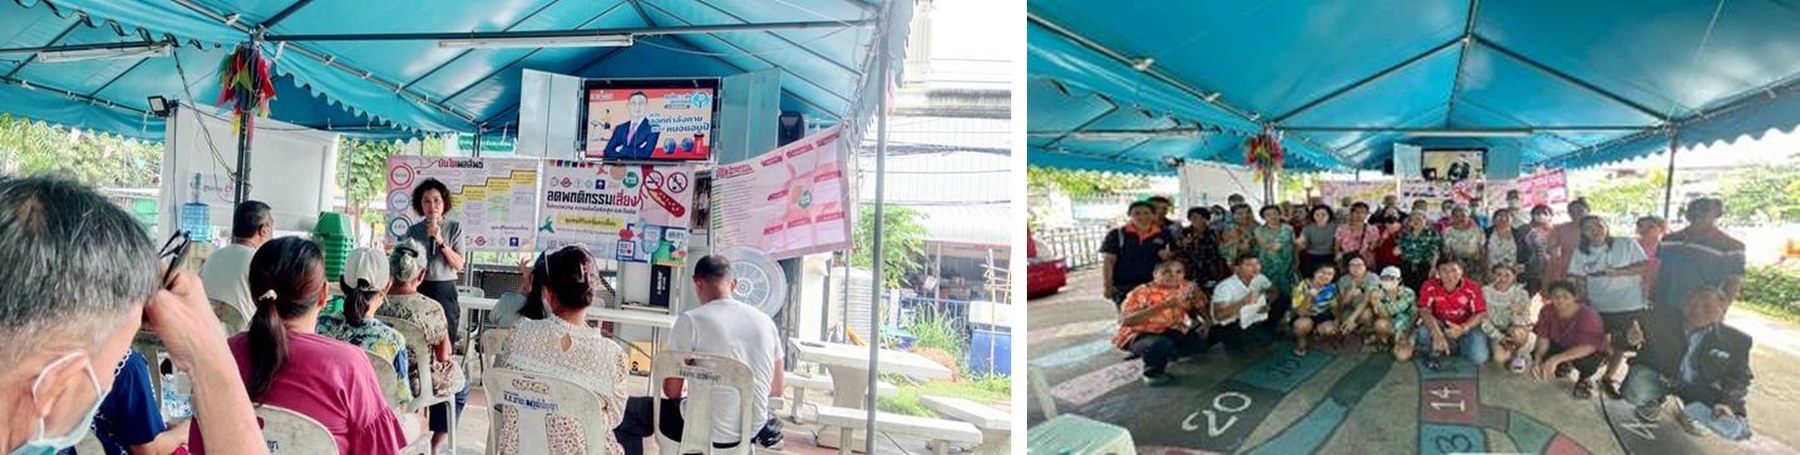 |
| Sirin and Friends: Siam University lecturer trains the risk group on “3 Or 2 Sor”, choosing healthy food, stress management and rest (17 August 2025) |
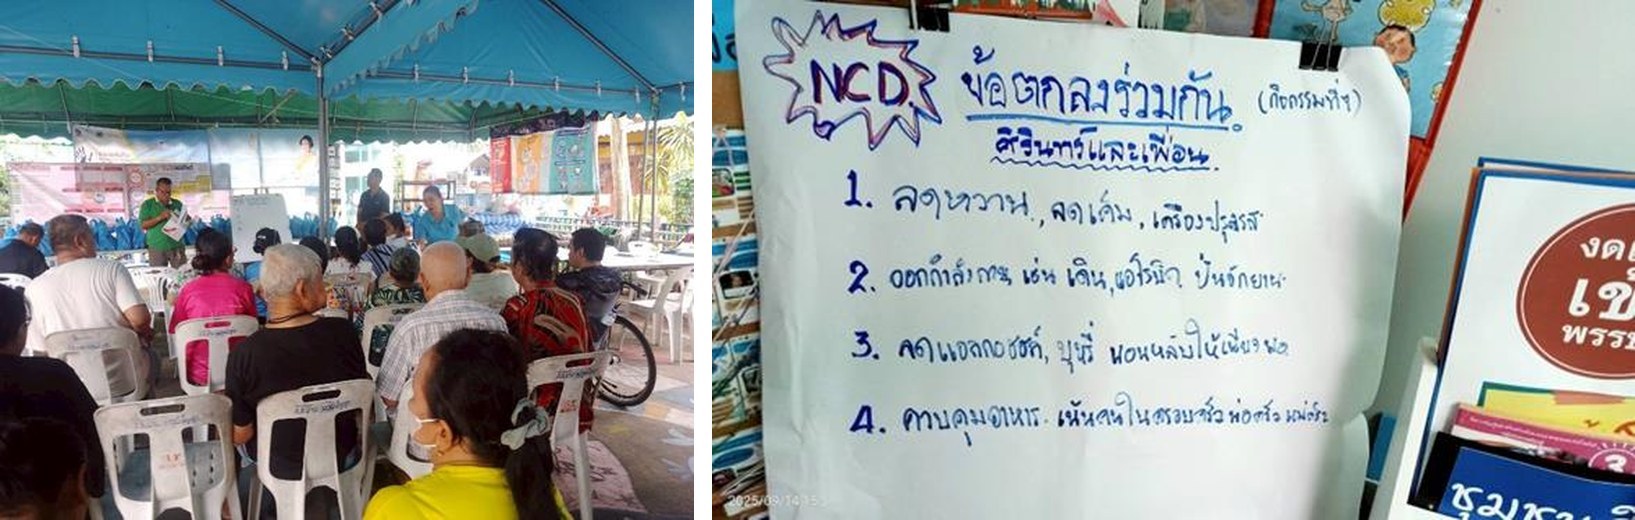 |
| Sirin and Friends: community agreement on reducing NCD risks and individual behaviour-change plans for 50 people (14 September 2025) |
 |
| (Left) Problem tree of the NODE communities: eating as one likes, lack of exercise, soft drinks and missed check-ups lead to chronic disease (Right) NODE activity log of the mentor team |
 |
| (Left) Workshop for community leaders, NCD risk reduction project, 20 September 2025 (Right) Community leaders with the “Reducing Risk Behaviours” project board |
| 3. Repeated assessment – monthly follow-up and feedback to participants |
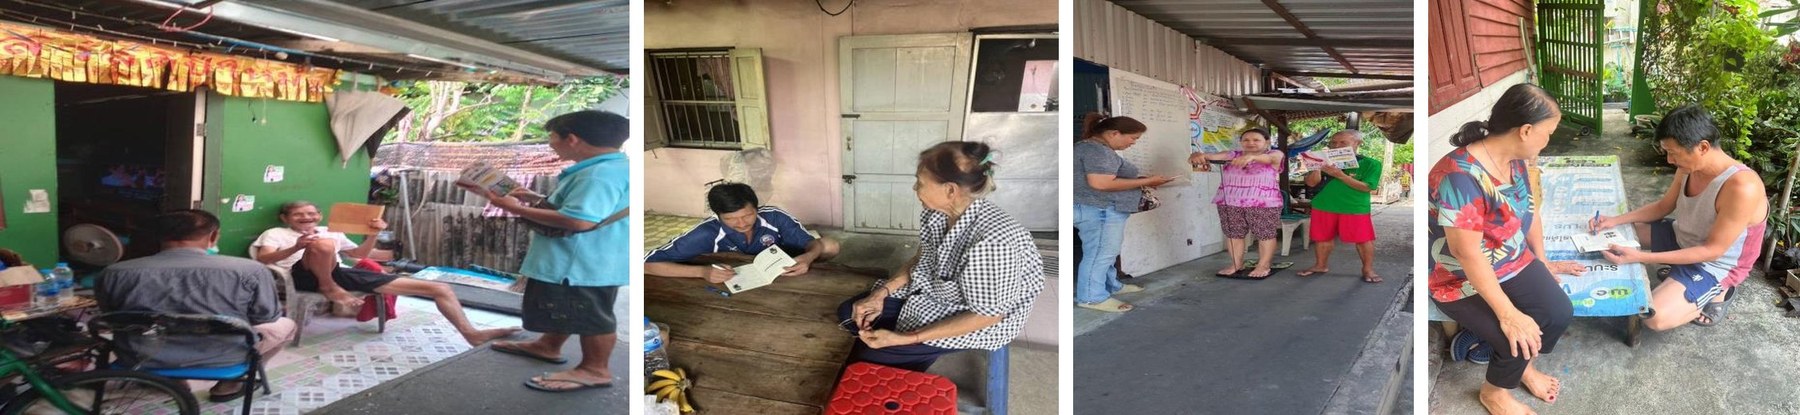 |
| Suphatthara Phiban: the working team visits the risk group every month, measures health indicators, records practices and gives advice (6 rounds, October 2025 – March 2026) |
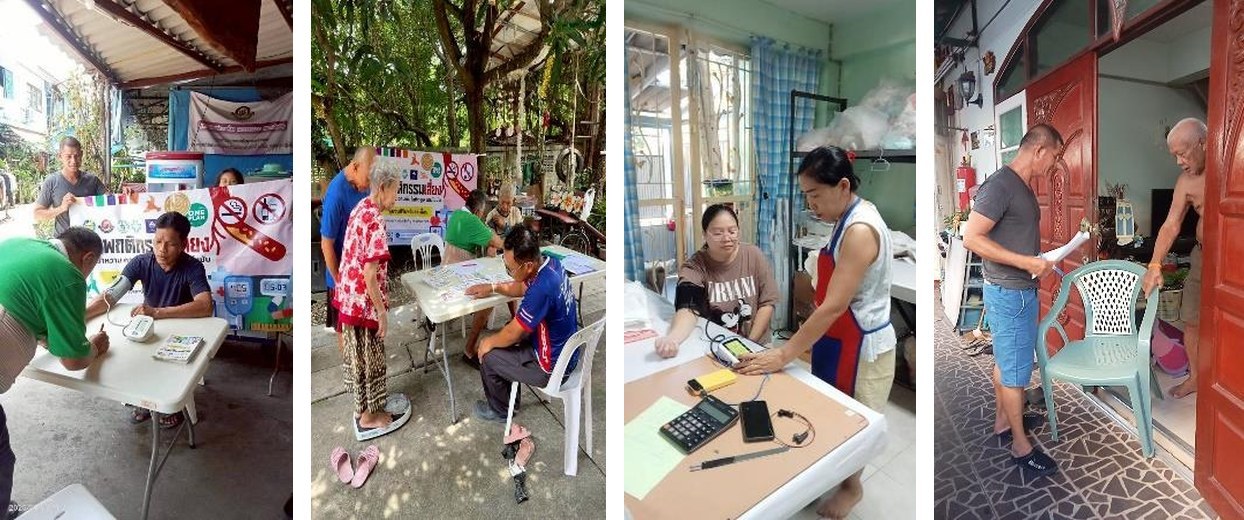 |
| Sirin and Friends: monthly home visits – blood pressure, blood sugar, weight and practice records |
 |
| Suphatthara Phiban: forum returning the monthly results to the risk group and household cooks, and revising the plans together (15 February 2026) |
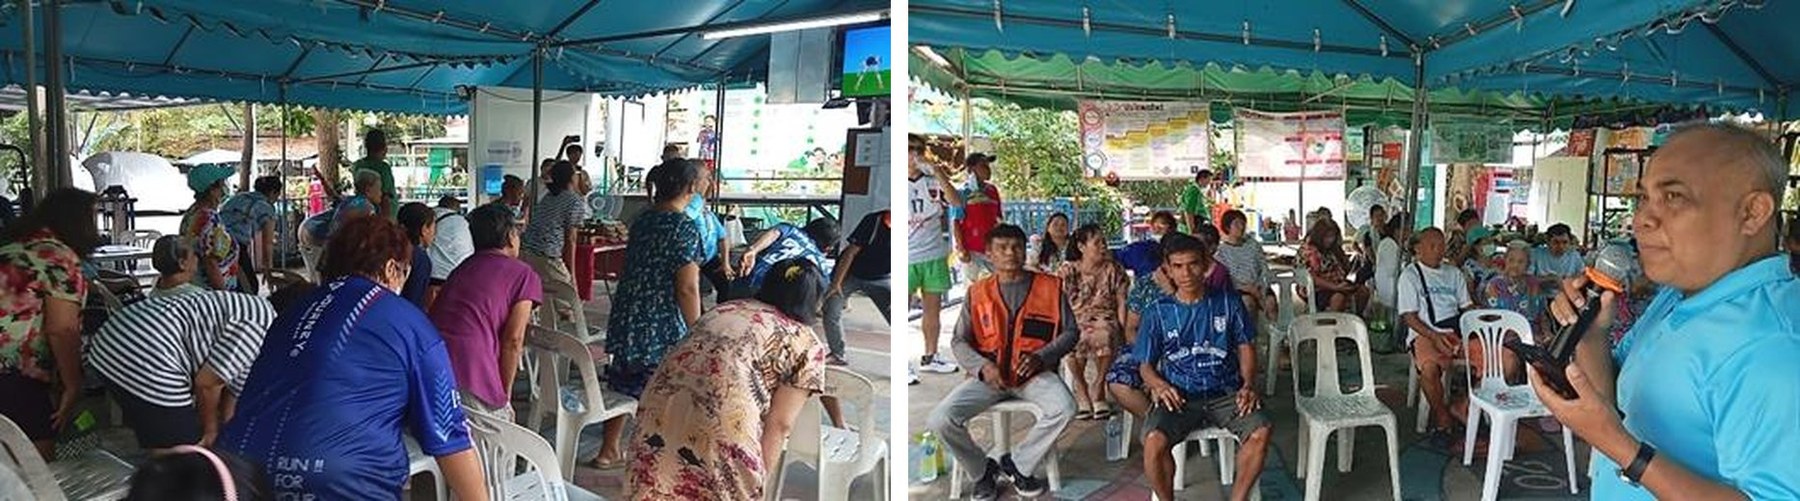 |
| Sirin and Friends: members receive their own health data and share problems and solutions (15 March 2026) |
 |
| NODE Phasi Charoen website: health data of the 16 communities, surveys before and after the project and two follow-up rounds |
| 4. Lessons learned and sharing of results |
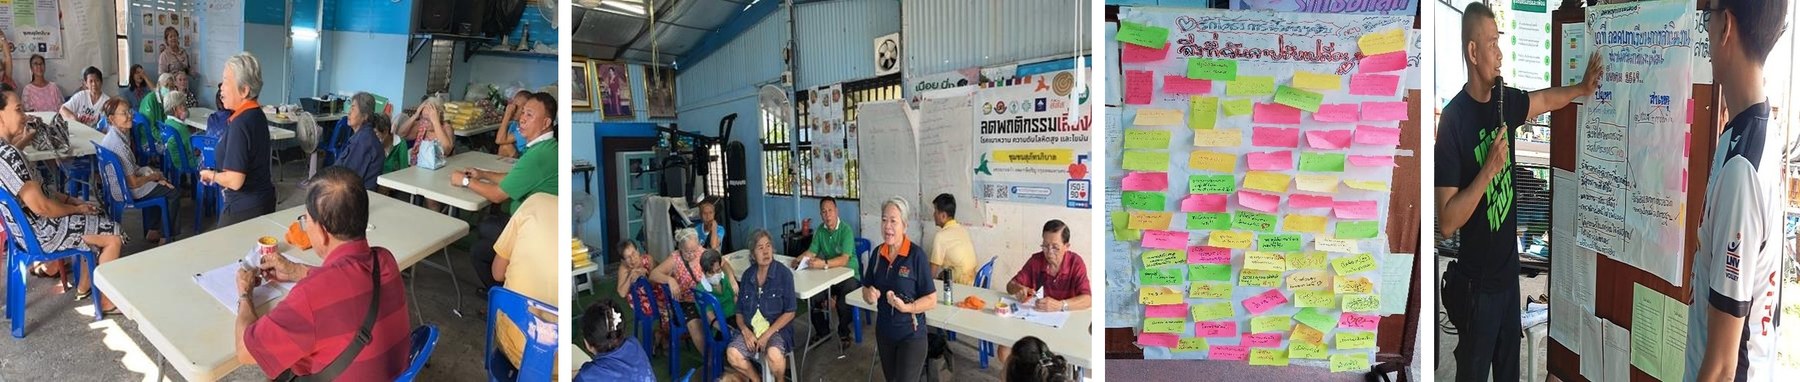 |
| Lessons-learned forums of Suphatthara Phiban and Sirin and Friends (29 March 2026): results returned to members, successes and problems recorded |
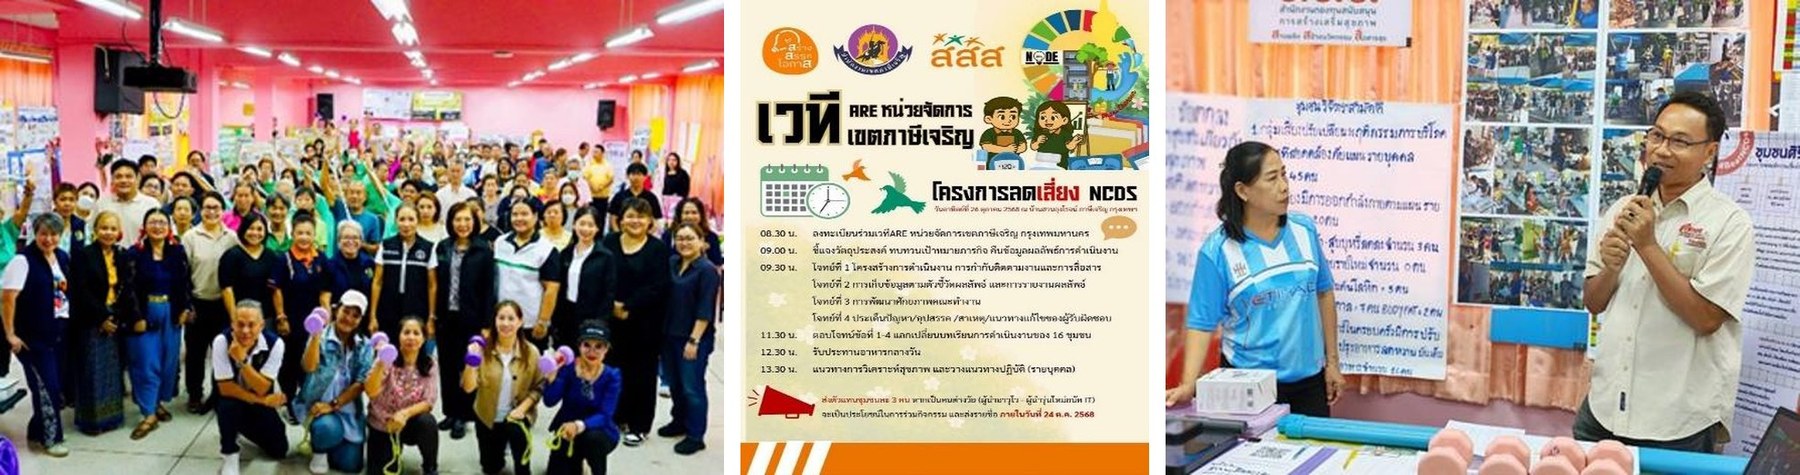 |
| NODE Phasi Charoen ARE forum, 22 March 2026: communities present the changes in health practices and recognise role models |
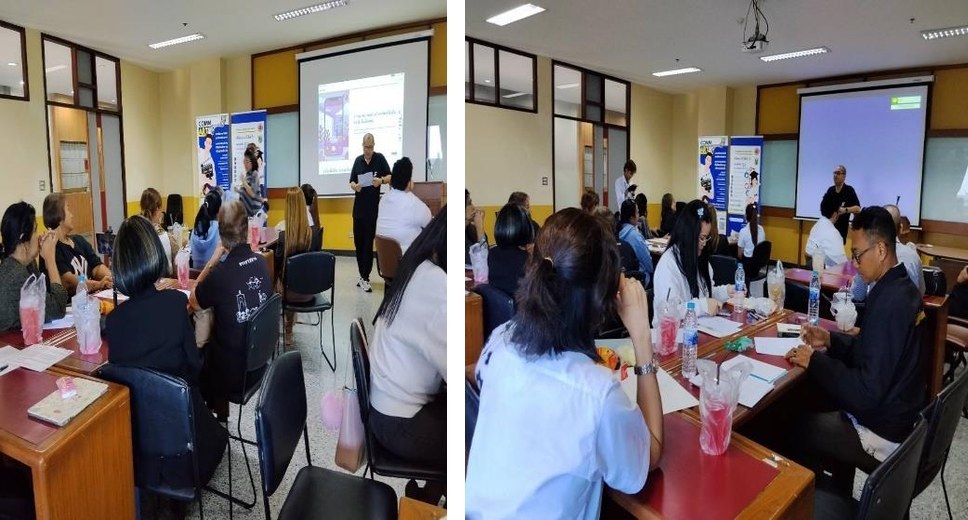 |
| Health media training for community data officers by Siam University lecturers at Siam University (6 December 2025) |
| Assessment and use of healthy lifestyle KAP (Siam University, Thailand) |
Description:
Siam University uses an assessment-driven approach to health promotion in its community-based Healthy University and Living Lab activities. University lecturers mentor the NODE Phasi Charoen district health promotion unit, whose NCD risk-reduction projects follow a full cycle: baseline assessment, use of the data, targeted health literacy training, monthly monitoring, feedback to participants and improvement of the plans (Table HP 1.2.1).
Assessment. The same pre-participation survey was used in three communities – Pattana Mu 7, Suphatthara Phiban and Sirin and Friends (226 people). It covers health measures (BMI, blood pressure, blood sugar), cooking and eating practices, daily practices such as exercise, smoking and alcohol, and confidence to change (Tables HP 1.2.2–1.2.5). Salty, fatty and sweet food, overweight and high blood pressure were common, and few people had an annual check-up.
Use of the results. The findings were used to set each person’s behaviour-change plan and the content of the training. Siam University lecturers returned the data and trained the risk groups on “3 Or 2 Sor” healthy living – healthy eating with less sugar, fat and salt, physical activity, stress management, rest, and stopping smoking and alcohol. Each community agreed on group rules, and participants set monthly goals (Table HP 1.2.6).
Monitoring and improvement. The working teams followed the risk groups every month for six rounds, returned the results, discussed them in forums and revised the plans. In Suphatthara Phiban 42 of 50 people exercised according to their plan and 47 did not become new patients; in Sirin and Friends 40 of 50 changed their eating and 35 exercised according to their plan. Measured indicators were mixed – blood pressure improved in 7 of 16 people in Suphatthara Phiban, while blood sugar worsened in 10 of 20 in Sirin and Friends, and these people were advised to see a doctor (Table HP 1.2.7).
Students and personnel. These community projects show how the University uses KAP assessment to improve health literacy activities. HURS HP 1.2 asks for KAP surveys of students and personnel; an annual Healthy Lifestyle KAP survey of students and personnel is planned from 2026 so that the University can reach the annual levels (Table HP 1.2.8).
Table HP 1.2.1 – The KAP cycle in two community projects, 2025–2026
| Step | Suphatthara Phiban | Sirin and Friends |
|---|---|---|
| 1. Baseline assessment (health measures and practices) | Behaviour survey 15 September – 15 October 2025; screening forum 19 October 2025 (blood pressure, BMI, blood sugar, body fat, muscle mass, waist; diet, exercise, smoking, alcohol) |
Screening 19 July 2025; behaviour survey 15 August 2025; measuring tools 20 September 2025 |
| 2. Results returned and training by Siam University lecturers (“3 Or 2 Sor”) |
15 November 2025 | 17 August 2025 |
| 3. Group rules and individual behaviour-change plans | 30 November 2025 – 80 participants; individual plans for 65 people |
14 September 2025 – individual plans for 50 people |
| 4. Monthly follow-up with feedback and plan revision (LINE group) |
6 rounds, 5 October 2025 – 8 March 2026 | 6 rounds, 5 October 2025 – 8 March 2026 |
| 5. Forums reflecting the results | 15 February 2026 (two sessions) | 15 February and 15 March 2026 |
| 6. Lessons learned and sharing | 29 March 2026; ARE forum 22 March 2026; data sent to the district office and public health centre |
29 March 2026; ARE forums 20 September 2025, 26 October 2025 and 22 March 2026 |
| Budget (three funds) | THB 163,525 (ThaiHealth 97,950; BMA health fund 23,875; strong-community fund 41,700) |
ThaiHealth, BMA health fund and strong-community fund |
Sources: One Reports of Suphatthara Phiban and Sirin and Friends communities (project 1 May 2025 – 30 April 2026).
Table HP 1.2.2 – Survey design
| Item | Detail |
|---|---|
| Survey | Pre-participation survey of the NODE Phasi Charoen sub-projects “Reducing Risk Behaviours for Diabetes, Hypertension and Dyslipidaemia” (One Plan, Thai Health Promotion Foundation). Siam University lecturers act as mentors and trainers of NODE Phasi Charoen. |
| Groups | Pattana Mu 7 Village (65), Suphatthara Phiban (81) and Sirin and Friends (80), Phasi Charoen, Bangkok – 226 people, mostly aged 41 and over. |
| Knowledge (K) | Not in the survey summary. The One Reports state that knowledge was given and understood, but give no test scores – add knowledge items or a pre- and post-test. |
| Attitude (A) | Confidence in reducing risk behaviours before joining: 79.85%, 69.44%, 68.97%. |
| Practice (P) | 10 cooking and eating practices (frequency score, maximum 5.00) and 13 daily practices (% of participants), plus annual check-ups and keeping doctor appointments. |
| Health measures | BMI, blood pressure; blood sugar, body fat, muscle mass and waist in the follow-up rounds. |
| Repeated assessment | Six monthly follow-up rounds and a summary after the project (Suphatthara Phiban, Sirin and Friends). |
Sources: pre-participation survey summaries (Pattana Mu 7; One Reports, Activity 6); NODE Phasi Charoen website.
Table HP 1.2.3 – Participants and health measures before the projects
| Health measure (people) | Pattana Mu 7 | Suphatthara Phiban | Sirin and Friends |
|---|---|---|---|
| Age Under 20 | 0 | 0 | 0 |
| Age 21–40 | 7 | 9 | 8 |
| Age 41–60 | 15 | 26 | 44 |
| Age 60 and over | 43 | 44 | 28 |
| Mean age (years) | 63.18 | 59.66 | 56.31 |
| BMI Under 18.5 – underweight | 11 | 8 | 8 |
| BMI 18.5–22.9 – normal | 30 | 28 | 23 |
| BMI 23.0–24.9 – overweight | 10 | 8 | 22 |
| BMI 25.0–29.9 – obese, level 1 | 11 | 20 | 25 |
| BMI 30.0 and over – obese, level 2 | 3 | 14 | 10 |
| Mean BMI | 21.95 | 24.78 | 24.84 |
| Blood pressure Under 120/80 – normal | 17 | 32 | 14 |
| Blood pressure 120–129/<80 – elevated | 8 | 7 | 5 |
| Blood pressure 130–139/80–89 – high risk | 4 | 10 | 3 |
| Blood pressure 140/90 and over – high | 24 | 17 | 16 |
| Blood pressure measured (people) | 53 | 66 | 38 |
Orange: overweight or obese, and blood pressure 140/90 or more. Totals in the summaries: age 65 / 79 / 80, BMI 65 / 78 / 88 and blood pressure 53 / 66 / 38 people; blood sugar was left blank.
Table HP 1.2.4 – Cooking and eating practices (frequency, maximum 5.00)
| Cooking and eating practice (mean of 5.00) | Pattana Mu 7 | Suphatthara Phiban | Sirin and Friends |
|---|---|---|---|
| Adds sugar before eating | 2.53 | 3.27 | 2.53 |
| Adds salty seasoning before eating | 3.16 | 3.17 | 2.82 |
| Uses sweeteners instead of sugar | 2.12 | 2.10 | 2.08 |
| Boils, bakes or steams instead of stir-frying or deep-frying | 3.56 | 3.56 | 3.19 |
| Eats fresh green vegetables, fruit, tubers or roots | 3.51 | 4.36 | 3.75 |
| Eats high-fat food, e.g. braised pork leg on rice, palo | 3.01 | 3.19 | 2.82 |
| Eats instant noodles or canned food | 2.73 | 2.74 | 2.51 |
| Eats fried food, e.g. fried chicken, fried fish cakes | 3.28 | 3.11 | 3.12 |
| Eats sweets, Thai desserts or bakery | 2.90 | 3.44 | 2.87 |
| Drinks sweet drinks or soft drinks | 2.80 | 2.70 | 2.62 |
Orange: risky practices with a mean above 3.10 in at least one community. A higher score means the practice is more frequent.
Table HP 1.2.5 – Daily practices, attitude and health history (% of participants)
| Daily practice or health history (%) | Pattana Mu 7 | Suphatthara Phiban | Sirin and Friends | KAP domain |
|---|---|---|---|---|
| 1. Likes sweet food (more than 6 teaspoons of sugar a day) | 21.54 | 38.27 | 21.53 | Practice |
| 2. Likes salty food or sodium (more than 1 teaspoon a day) | 55.38 | 32.10 | 30.88 | Practice |
| 3. Likes fatty, fried or grilled food (more than 6 teaspoons of fat a day) |
46.15 | 34.57 | 27.94 | Practice |
| 4. Overeats or snacks between meals | 10.77 | 8.64 | 16.18 | Practice |
| 5. Does not eat vegetables and fruit | 1.54 | 8.64 | 5.88 | Practice |
| 6. Food allergy | 0.00 | 0.00 | 8.82 | Health history |
| 7. Eats fewer than 3 meals a day | 15.38 | 16.05 | 25.00 | Practice |
| 8. Exercises or controls weight | 12.31 | 35.80 | 45.59 | Practice |
| 9. Often irritable or stressed | 1.54 | 9.88 | 16.18 | Practice |
| 10. Uses sedatives | 3.08 | 2.47 | 2.94 | Practice |
| 11. Smokes cigarettes, tobacco or rolled leaf regularly | 7.69 | 16.00 | 10.29 | Practice |
| 12. Drinks alcohol regularly | 29.23 | 17.28 | 16.18 | Practice |
| 13. Someone close smokes regularly | 7.69 | 40.74 | 17.45 | Practice |
| 14. Has a chronic disease | 73.85 | 45.68 | 39.71 | Health history |
| 15. Takes medicines now | 67.69 | 43.21 | 29.41 | Health history |
| 16. Uses other health products | 0.00 | 3.70 | 5.88 | Health history |
| 17. Uses mixed-drug sets (“ya chut”) | 0.00 | 1.23 | 4.41 | Health history |
| 18. Confidence in reducing risk behaviours before joining the project |
79.85 | 69.44 | 68.97 | Attitude |
| 19. Illness history of parents | 0.00 | 17.28 | 25.00 | Health history |
| 20. Illness history of brothers or sisters | 1.54 | 9.88 | 13.24 | Health history |
| 21. Drug allergy history | 0.00 | 2.47 | 4.41 | Health history |
| 22. History of NCDs | 3.08 | 4.94 | 19.12 | Health history |
| 23. Has an annual health check-up | 7.69 | 1.23 | 22.06 | Practice |
| 24. Keeps doctor appointments | 10.77 | 17.28 | 23.53 | Practice |
Orange: the most common risk practices. Green: attitude (confidence to change).
Table HP 1.2.6 – Use of the results in the projects
| Finding of the baseline survey | Action in the projects | Evidence |
|---|---|---|
| Salty, fatty and sweet food common (salty food 30.88–55.38%; sweet food up to 38.27%) |
“3 Or 2 Sor” training by Siam University lecturers; group rules – less sweet, fat and salt, plate of 2 parts vegetables; healthy menus; sodium testing of food in shops and households |
Sections 2–3; One Reports |
| Many overweight or obese people; exercise or weight control 12.31–45.59% |
Individual plans with monthly weight-loss and exercise goals; exercise groups at least 3 times a week; exercise workshop (Sirin and Friends, 24 November 2025) |
Sections 2–3 |
| High blood pressure common; few annual check-ups (1.23–22.06%) | Monthly measurement of blood pressure and blood sugar with feedback; people with repeated high values advised to see a doctor |
Section 3; Table HP 1.2.7 |
| Smoking and alcohol (smoking 7.69–16.00%; alcohol 16.18–29.23%) | Plans to stop or reduce smoking and drinking; follow-up of smokers and drinkers |
Table HP 1.2.7 |
| Confidence to change 68.97–79.85% | Community leaders and village health volunteers trained to follow up and motivate the risk group |
One Reports |
Sources: survey summaries and One Reports; NODE Phasi Charoen workshop materials (20 September 2025).
Table HP 1.2.7 – Results after six monthly follow-up rounds
| Result after 6 monthly rounds (risk group of 50) |
Suphatthara Phiban | Sirin and Friends |
|---|---|---|
| Changed eating according to the individual plan | 30 of 50 (60%) | 40 of 50 (80%) |
| Exercised according to the individual plan | 42 of 50 (84%) | 35 of 50 (70%) |
| Did not become a new patient | 47 of 50 (94%) | 45 of 50 (90%) |
| Lower blood pressure, BMI, blood sugar and % body fat (reported) |
15 of 50 (30%) | 45 of 50 (90%) [check – see blood sugar trend] |
| Smoking and drinking | Smokers 9: 3 smoke less, 1 quit; drinkers 7: 2 drink less | Report: no smoking or drinking in the risk group (mostly older people) |
| Measured trend | Blood pressure (16 people): better 7, stable 4, worse 5; visceral fat (15): mean 5.4 → 4.9; diabetes group on medicines (10): mean blood sugar still above 130 mg/dL – referred for clinical follow-up |
Blood sugar (17): normal 2 → 4, high 8 → 7; trend (20): better 5, same 5, worse 10; 7 with repeated high values advised to recheck and see a doctor |
| Cooking and environment | Shops and household cooks use less seasoning powder, sugar, salt and fat and steam instead of frying |
Household cooks reduced salt (sodium test 0.7 or less) and grow vegetables at home |
Sources: One Reports – Suphatthara Phiban (Activities 11–13) and Sirin and Friends (results table, Activities 10–12). Group totals only; no individual data are shown.
Table HP 1.2.8 – Other KAP assessments in the past four years
| Year | Assessment | Group | Use of results |
|---|---|---|---|
| 2024 | Knowledge of and attitudes towards e-cigarettes before and after a self-efficacy programme (Thai Journal of Nursing, 73(1)) |
Nursing student leaders, Siam University | [confirm] |
| 2024 | Pre- and post-test of knowledge and tobacco attitude questionnaire, “Bright Youth, Aware of Tobacco Harms” |
101 young participants | Club plans the next project with a PDCA cycle |
| 2026 | Health screening and health behaviour assessment, Faculty of Nursing Elderly Club (29 June 2026) |
77 older club members | Follow-up of members at risk |
Sources: Faculty of Nursing publication list; “Bright Youth, Aware of Tobacco Harms” project report (January 2024); Elderly Club evaluation report (29 June 2026).
Evidence to attach:
-
NODE Phasi Charoen website: https://sites.google.com/view/nodepscr/home (“Data of 16 communities”).